M&A Lookback on the North American Food Sector 2024
Transactions overview of the North American Food sector in 2024
M&A activity in the North American food sector exhibited fluctuations between 2018 to 2024, with notable trends in both deal count and transaction value. A significant surge in 2021 was driven by a post-pandemic recovery as companies sought growth opportunities. However, the market experienced a slight slowdown from 2022 onward, influenced by macroeconomic factors such as inflation and rising interest rates.
North American Food Sector M&A Transactions1,2, 2018-2024
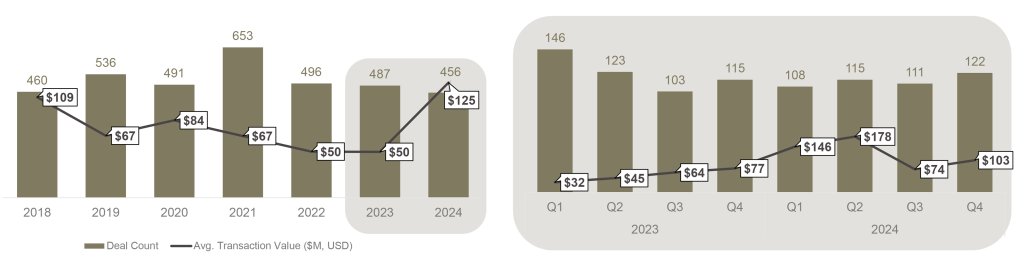
Reported Deals in CapIQ & Pitchbook
Negotiations also played a critical role in this trend. As part of the 2024 North American Food Sector Survey, Richter surveyed 125 executives from private middle value chain food companies. Nearly half of those who engaged in M&A discussions but did not complete a transaction cited the negotiation process as the primary deterrent, describing it as time-consuming and complex. Additionally, 27% of respondents pointed to a lack of strategic alignment and valuation gaps between buyers and sellers as other complicating factors. For private operators, the negotiation phase is particularly challenging, as most lack the resources, experience and dedicated M&A teams to streamline discussions and resolve issues efficiently, often resulting in prolonged negotiations that hinder successful deal closures.
“ We found that the process was complex and time-consuming, causing delays and ultimately hindering the success of the deal.” – US Meat Distribution Company
To improve M&A outcomes, private companies should invest in preparation, engage experienced advisors, and define key deal parameters early. This approach enhances strategic alignment, fosters open communication, and ensures proactive due diligence, all of which reduces deal friction in the negotiation process.
“There was insufficient communication between the key stakeholders at different stages of negotiations and due diligence, leading to misunderstandings.” CAN Meat Processing and Distribution Company
Despite the decrease in total deals in 2024, transaction values increased significantly, reflecting a shift towards larger, more strategic acquisitions. The first half of the year featured particularly large deals with an average of $146M in Q1 and $178M in Q2. Notable transactions in the period include the acquisition of family-owned Philadelphia Macaroni Company by Windland Foods for $495M, creating the largest privately-owned pasta manufacturer in the US, and the acquisition of Cibo Vita, a better-for-you snack company, by Citation Capital LLC for $480M. These high-value deals demonstrate that M&A remains a key trend in the sector, with private equity continuing to show strong interest in acquiring companies with high growth potential.
Valuations overview of the North American Food sector in 2024
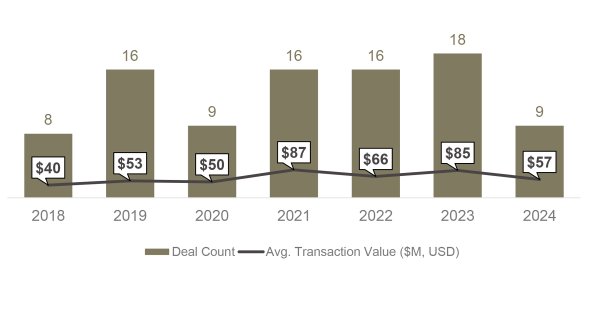
Private equity-backed companies focused on food manufacturing, wholesale, and distribution, completed transactions at lower average enterprise values in 2024 compared to 2023, indicating a shift toward smaller deals in a more cautious market. This is in line with our 2024 survey, where 70% of respondents prefer to acquire smaller organizations with opportunities for operational improvements and expanded offerings, rather than focusing on capturing immediate market share.
Select Private Equity-Backed Company Food3 M&A Transactions, 2018-2024
Select Private Equity-Backed Manufacturing, Wholesale and Distribution3 Multiples ($M, USD), 2018-2024
| By year |
|||||||
|---|---|---|---|---|---|---|---|
| 2018 | 2019 | 2020 | 2021 | 2022 | 2023 | 2024 | |
| # Transactions | 8 | 16 | 9 | 16 | 16 | 18 | 9 |
| Avg TEV | 39.5 | 53.0 | 49.5 | 87.2 | 66.4 | 85.4 | 57.1 |
| TEV / Rev | 1.2x | 1.1x | 1.21x | 1.5x | 1.6x | 1.1x | 1.3x |
| TEV / EBITDA | 7.8x | 7.0x | 7.0x | 7.7x | 9.4x | 7.6x | 8.3x |
| By TEV (Past 7 Years) | ||||
| $10-25M | $25-50M | $50-100M | $100-500M | |
| # Transactions | 23 | 20 | 24 | 17 |
| Avg TEV | 17.9 | 34.2 | 64.7 | 185.6 |
| TEV / Rev | 1.2x | 1.0x | 1.3x | 1.8x |
| TEV / EBITDA | 7.1x | 6.9x | 7.9x | 9.9x |
Reported deals in GF Data with disclosed valuation multiples
However, despite a decrease in average transaction value, multiples increased. This suggests that companies who successfully closed transactions—despite negotiation challenges and broader economic uncertainties—were perceived as higher value. This is evident in the increase in TEV/EBITDA multiples to 8.3x in 2024, even as the average transaction value dropped from $85.4M in 2023 to $57.1M in 2024. The increase in multiples reflects a premium for high-quality assets, particularly given that the historical average TEV/EBITDA multiple for the $50-100M enterprise value range was 7.9x.
This trend is consistent with broader market dynamics, where the average TEV/EBITDA multiple reached 8.5x4 in 2024. The higher multiples suggest that, despite smaller transaction sizes, investors continue to place a premium on companies with strategic value despite economic headwinds.
A notable example is the acquisition of Summer Garden Food Manufacturing by Lassonde Industries for $280M, with an implied multiple of 10.0x, in its strategy to expand its product offering and enhance manufacturing capabilities.
Notable transactions in the North American Food sector in 2024
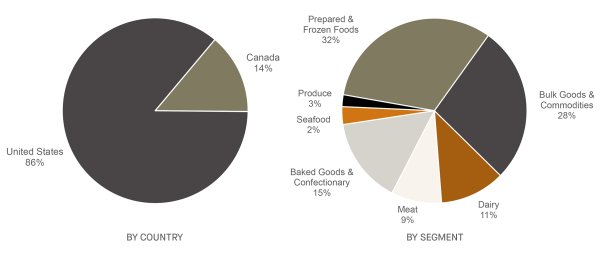
In 2024, North American food transactions were predominantly concentrated in the US, with the prepared and frozen foods, and bulk goods and commodities sectors experiencing highest activity.
2024 North American Food Transactions5,6
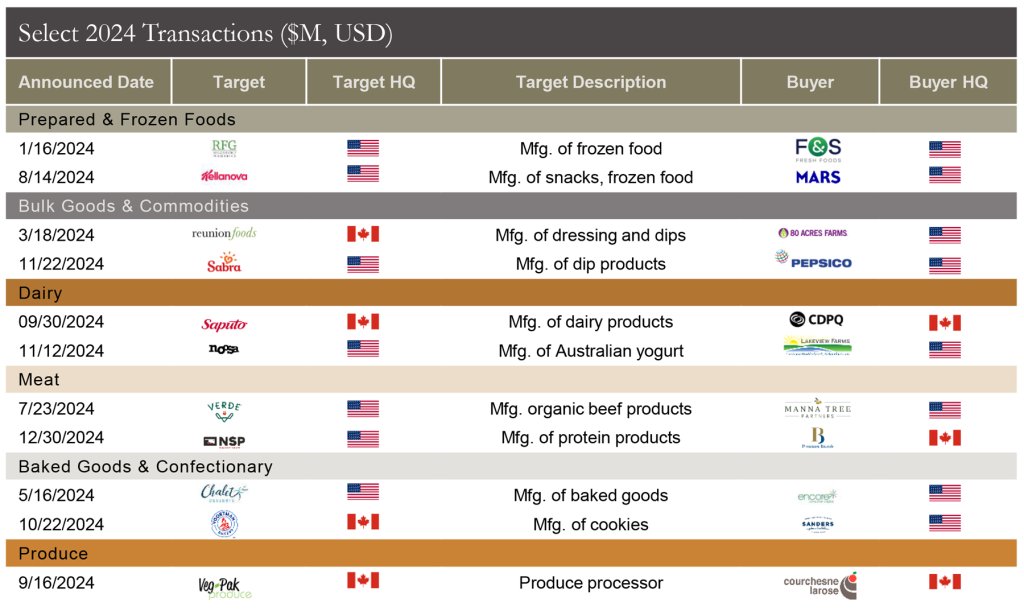
Select 2024 Transactions7 ($M, USD)


Notes:
- Food industry defined as Food Distributors and Food Products (excluding Animal Feed) within Pitchbook and Capital IQ databases.
- Average transaction value excludes deals with no disclosed value (i.e., $0) and only considers transactions valued below $500M.
- NAICS 311 (excluding animal feed) and 4244 in GF Data.
- Average TEV/EBITDA multiples only includes transactions with a value <$500M
- Data from Pitchbook and Capital IQ.
- CapitalIQ data only.
- Additional investment by CDPQ brings CDPQ’s stake in Saputo to 4.5%.
Sources: Pitchbook, Capital IQ, GF Data